Paul Hammant's Blog: NightWatch Component Testing and visual documentation
This blog entry follows my recent exploration of Playwright, Cypress, and Selenium-WebDriver for component testing, I’ve now completed a migration to NightWatch.js. This post documents the complete transition from Selenium WebDriver to NightWatch for a particular test-harness pattern for component testing.
NightWatch Component Testing Migration
Branch: nightwatch_instead_of_selenium
Note: I didn’t start with the Playwright branch for this one - I started with the canonical selenium-webdriver one, because NightWatch is closer to that ecosystem than it is to anything else.
The Migration Challenge
Starting with a fully functional Selenium WebDriver test suite covering both component tests and e2e tests, the goal was to migrate everything to NightWatch.js while preserving:
- All test functionality and coverage
- Screenshot capabilities for visual documentation
- The same test harness pattern for component testing
- Performance optimizations from the Selenium implementation
Why NightWatch.js?
NightWatch.js offers several advantages over raw Selenium WebDriver:
- Cleaner more modern syntax: More readable test code with built-in assertions
- Better error reporting: Detailed failure messages with stack traces
- Integrated screenshots: Built-in screenshot capabilities with failure capture
- Configuration simplicity: Single configuration file vs multiple setup files
- Browser management: Automatic WebDriver lifecycle management (yes, it uses selenium-webDriver under the hood)
- Parallel execution: Built-in support for parallel test execution (though we’re not using that here)
NightWatch Migration work
Component Tests: hundreds of assertions
- Controls Component: 91 assertions across 5 scenarios
- DebugConsole Component: 125 assertions across 6 scenarios
- UnitsConversion Component: 57 assertions across 3 scenarios
- Performance: Same visual test harness pattern with optimized navigation
E2E Tests: 127 assertions (less important for this blog entry)
- Doppler App Tests: 96 assertions covering main app functionality
- Audio Processing Tests: 31 assertions covering file upload and audio features
- Responsive Testing: Mobile viewport and cross-browser compatibility
Visual Implementation: Identical Test Documentation
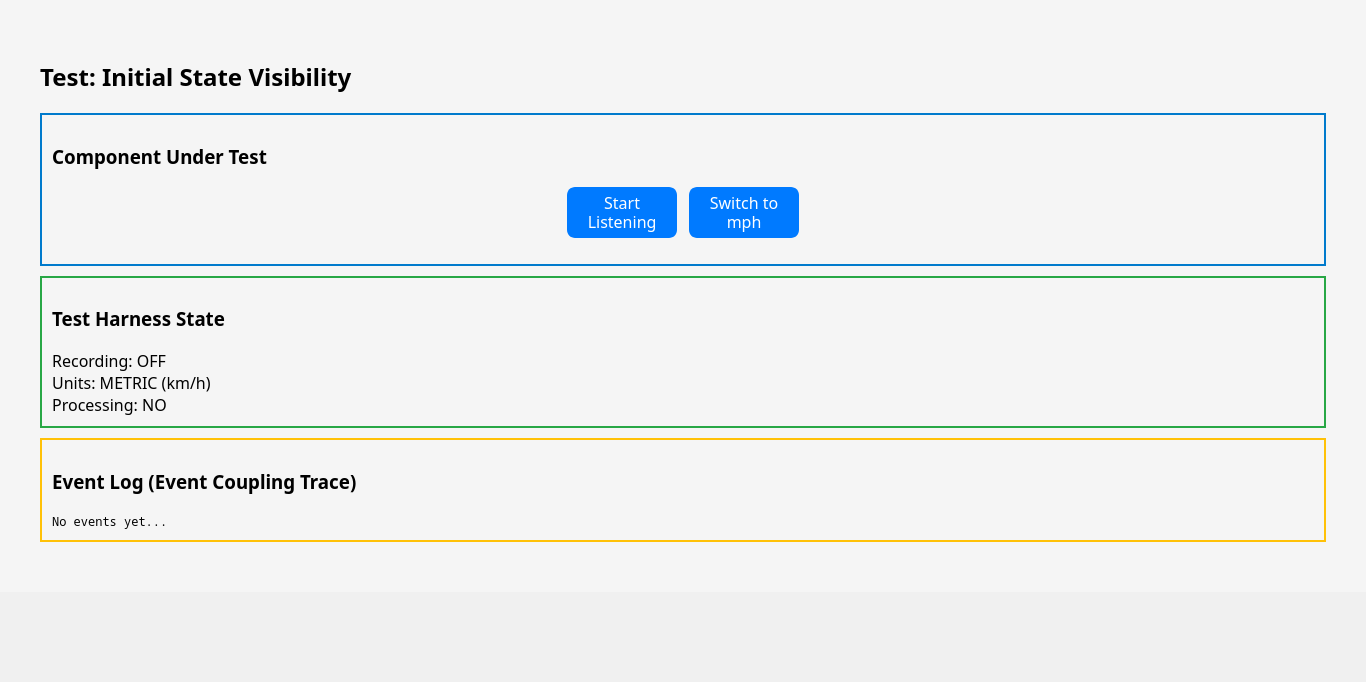
The NightWatch implementation preserves the same visual-first approach, generating detailed screenshots for each test interaction. Here’s the Test Harness Component Testing pattern now powered by NightWatch. Those are gated on an env-var so could be turned off.
Example: Component State Testing
Initial State: Component Ready
Recording Toggle Interaction
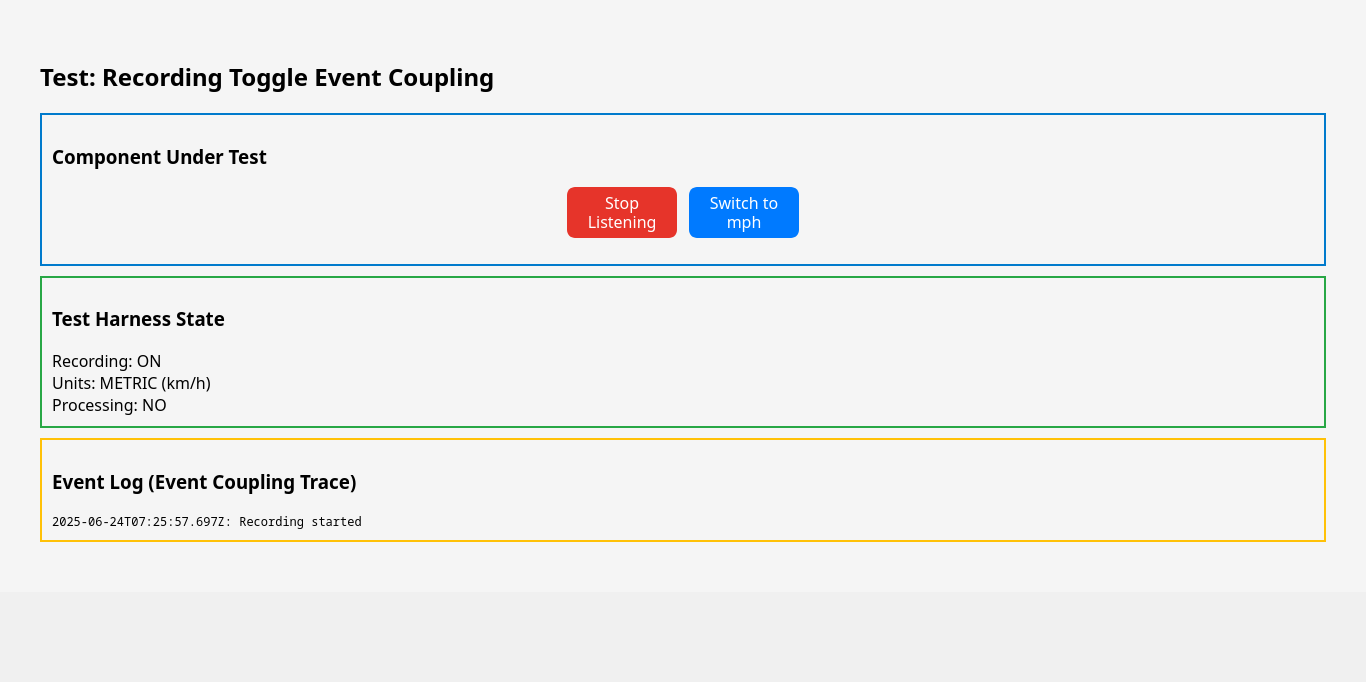
The NightWatch implementation maintains the same three-section visual pattern:
- Component Under Test (blue border) - The actual React component being tested
- Test Harness State (green border) - Shows parent component state reflecting real app conditions
- Event Log (yellow border) - Complete interaction history for debugging and verification
Component and E2e tests via NightWatch
Component Test Utils: nightwatch-utils.js
- Test harness navigation and interaction
- Component-specific assertions
- Screenshot management for test documentation
E2E Test Utils: nightwatch-e2e-utils.js
- Full application navigation
- Cross-component integration testing
- Mobile responsive testing utilities
Performance Optimizations Preserved
The NightWatch migration maintained all performance optimizations from the Selenium implementation:
- Shared browser instances: Single Firefox instance per test suite. I am not sure if I am doing this in an idiomatically correct way for a forced serial use of NightWatchJs.
- Fast page updates:
window.location.replace()instead of full navigation - Optimized waits: Implicit timeouts of 1-2 seconds vs default 10+ seconds
- Strategic screenshots: Only when not in CI or when
SKIP_SCREENSHOTSis false
Custom Dependency: @nightwatch/react Fork
This project uses a custom fork "@nightwatch/react": "github:paul-hammant/nightwatch-plugin-react#main" to update transitive dependencies that were several major versions behind, resolving React 18+ compatibility issues and security vulnerabilities while maintaining full API compatibility. Fingers crossed the Nightwatch team will process the pull request, and I get to delete the section.
Running the component tests
> react-app@2.1.2 test:ct
> npm run build:server --silent && nightwatch --config nightwatch.conf.js src/components/__tests__/**/*.ct.nightwatch.test.js

CSS imports will be handled by the server
Setting up NightWatch test environment...


[Controls Ct Nightwatch Test] Test Suite
───────────────────────────────────────────────────────────────────────────────
- Starting GeckoDriver on port 4444...

ℹ Connected to GeckoDriver on port 4444 (1542ms).
  Using: firefox (140.0) on LINUX.

- Loading url: http://localhost:3001/render-component/ControlsTestHarness?testName=Initial

  ℹ Loaded url http://localhost:3001/render-component/ControlsTestHarness?testName=Initial in 128ms
  ✔ Element <[data-testid="test-name"]> was present after 29 milliseconds.

  Running renders in test harness with initial state visible:
───────────────────────────────────────────────────────────────────────────────────────────────────
  ✔ Element <[data-testid="test-name"]> was present after 24 milliseconds.
  ✔ Element <[data-testid="record-button"]> was present after 11 milliseconds.
  ✔ Testing if element's <[data-testid="record-button"]> inner text equals 'Start
Listening' (11ms)
  ✔ Element <[data-testid="unit-toggle-button"]> was present after 5 milliseconds.
  ✔ Testing if element's <[data-testid="unit-toggle-button"]> inner text equals 'Switch to
mph' (11ms)
  ✔ Element <[data-testid="harness-recording-state"]> was present after 4 milliseconds.
  ✔ Testing if element's <[data-testid="harness-recording-state"]> inner text equals 'Recording: OFF' (9ms)
  ✔ Element <[data-testid="harness-units-state"]> was present after 3 milliseconds.
  ✔ Testing if element's <[data-testid="harness-units-state"]> inner text equals 'Units: METRIC (km/h)' (8ms)
  ✔ Element <[data-testid="test-name"]> was present after 2 milliseconds.
  ✔ Testing if element's <[data-testid="test-name"]> inner text equals 'Test: Initial State Visibility' (9ms)

  ✨ PASSED. 11 assertions. (220ms)

  Running demonstrates event coupling - recording toggle:
───────────────────────────────────────────────────────────────────────────────────────────────────
  ✔ Element <[data-testid="test-name"]> was present after 21 milliseconds.
  ✔ Element <[data-testid="record-button"]> was present after 4 milliseconds.
  ✔ Testing if element's <[data-testid="record-button"]> inner text equals 'Start
Listening' (17ms)
  ✔ Element <[data-testid="harness-recording-state"]> was present after 2 milliseconds.
  ✔ Testing if element's <[data-testid="harness-recording-state"]> inner text equals 'Recording: OFF' (9ms)
  ✔ Element <[data-testid="event-log"]> was present after 2 milliseconds.
  ✔ Testing if element's <[data-testid="event-log"]> inner text equals 'No events yet...' (11ms)
  ✔ Element <[data-testid="record-button"]> was present after 2 milliseconds.
  ✔ Element <[data-testid="record-button"]> was visible after 12 milliseconds.

  PASSED: 9 passed (481ms)


[Debug Console Ct Nightwatch Test] Test Suite
───────────────────────────────────────────────────────────────────────────────
- Starting GeckoDriver on port 4444...

ℹ Connected to GeckoDriver on port 4444 (1580ms).
  Using: firefox (140.0) on LINUX.

- Loading url: http://localhost:3001/render-component/DebugConsoleTestHarness?testName=Initial

  ℹ Loaded url http://localhost:3001/render-component/DebugConsoleTestHarness?testName=Initial in 113ms
  ✔ Element <[data-testid="test-name"]> was present after 19 milliseconds.

  Running loadDebugTestHarness:
───────────────────────────────────────────────────────────────────────────────────────────────────
  ✔ Element <[data-testid="test-name"]> was present after 24 milliseconds.

  ✨ PASSED. 1 assertions. (39ms)

  Running comprehensive debug console functionality and states:
───────────────────────────────────────────────────────────────────────────────────────────────────
  ✔ Element <[data-testid="test-name"]> was present after 19 milliseconds.
  ✔ Element <[data-testid="debug-toggle-button"]> was present after 8 milliseconds.
  ✔ Testing if element's <[data-testid="debug-toggle-button"]> inner text equals 'Show Debug Console' (15ms)
  ✔ Expected element <[data-testid="debug-console-container"]> to not be present - element was not found (1011ms)
  ✔ Expected element <[data-testid="debug-toggle-button"]> to have attribute "aria-label" which equals: "Show Debug Console" (12ms)
  ✔ Expected element <[data-testid="debug-toggle-button"]> to have attribute "class" which contains: "debug-toggle-button" (8ms)
  ✔ Element <[data-testid="harness-log-count"]> was present after 3 milliseconds.
  ✔ Testing if element's <[data-testid="harness-log-count"]> inner text equals 'Log Count: 4' (10ms)
  ✔ Element <[data-testid="harness-intercept-state"]> was present after 3 milliseconds.
  ✔ Testing if element's <[data-testid="harness-intercept-state"]> inner text equals 'Intercept Console: NO' (8ms)
  ✔ Expected element <[data-testid="event-log"]> to be visible (8ms)
  ✔ Expected element <[data-testid="debug-toggle-button"]> to be present (3ms)

  ✨ PASSED. 12 assertions. (1.222s)

  Running handles empty logs state:
───────────────────────────────────────────────────────────────────────────────────────────────────
  ✔ Element <[data-testid="test-name"]> was present after 19 milliseconds.
  ✔ Element <[data-testid="debug-toggle-button"]> was present after 2 milliseconds.
  ✔ Testing if element's <[data-testid="debug-toggle-button"]> inner text equals 'Show Debug Console' (11ms)
  ✔ Expected element <[data-testid="debug-console-container"]> to not be present - element was not found (1004ms)
  ✔ Element <[data-testid="harness-log-count"]> was present after 6 milliseconds.
  ✔ Testing if element's <[data-testid="harness-log-count"]> inner text equals 'Log Count: 0' (13ms)

  ✨ PASSED. 6 assertions. (1.098s)

  Running handles large number of log entries:
───────────────────────────────────────────────────────────────────────────────────────────────────
  ✔ Element <[data-testid="test-name"]> was present after 27 milliseconds.
  ✔ Element <[data-testid="harness-log-count"]> was present after 3 milliseconds.
  ✔ Testing if element's <[data-testid="harness-log-count"]> inner text equals 'Log Count: 50' (8ms)
  ✔ Element <[data-testid="debug-toggle-button"]> was present after 3 milliseconds.
  ✔ Testing if element's <[data-testid="debug-toggle-button"]> inner text equals 'Show Debug Console' (8ms)
  ✔ Expected element <[data-testid="debug-console-container"]> to not be present - element was not found (1011ms)

  ✨ PASSED. 6 assertions. (1.144s)

  Running debug console with production-like log scenarios:
───────────────────────────────────────────────────────────────────────────────────────────────────
  ✔ Element <[data-testid="test-name"]> was present after 25 milliseconds.
  ✔ Element <[data-testid="debug-toggle-button"]> was present after 5 milliseconds.
  ✔ Testing if element's <[data-testid="debug-toggle-button"]> inner text equals 'Show Debug Console' (12ms)
  ✔ Expected element <[data-testid="debug-console-container"]> to not be present - element was not found (1006ms)
  ✔ Element <[data-testid="harness-log-count"]> was present after 5 milliseconds.
  ✔ Testing if element's <[data-testid="harness-log-count"]> inner text equals 'Log Count: 10' (10ms)
  ✔ Expected element <[data-testid="event-log"]> to be present (3ms)
  ✔ Expected element <[data-testid="debug-toggle-button"]> to be present (3ms)
  ✔ Element <[data-testid="harness-log-count"]> was present after 5 milliseconds.
  ✔ Testing if element's <[data-testid="harness-log-count"]> inner text equals 'Log Count: 10' (10ms)

  ✨ PASSED. 10 assertions. (1.182s)

  Running expanded debug console with production-like content:
───────────────────────────────────────────────────────────────────────────────────────────────────
  ✔ Element <[data-testid="test-name"]> was present after 21 milliseconds.
  ✔ Element <[data-testid="harness-log-count"]> was present after 3 milliseconds.
  ✔ Testing if element's <[data-testid="harness-log-count"]> inner text equals 'Log Count: 10' (10ms)
  ✔ Element <[data-testid="harness-expanded-state"]> was present after 2 milliseconds.
  ✔ Testing if element's <[data-testid="harness-expanded-state"]> inner text equals 'Debug Console State: EXPANDED (for testing)' (9ms)
  ✔ Expected element <[data-testid="debug-console-container"]> to be visible (8ms)
  ✔ Element <[data-testid="debug-toggle-button"]> was present after 2 milliseconds.
  ✔ Testing if element's <[data-testid="debug-toggle-button"]> inner text equals 'Hide Debug Console' (7ms)
  ✔ Expected element <[data-testid="debug-log-entry-0"]> to be visible (8ms)
  ✔ Expected element <[data-testid="debug-log-entry-4"]> to be visible (10ms)
  ✔ Expected element <[data-testid="debug-log-entry-9"]> to be visible (8ms)
  ✔ Element <[data-testid="debug-log-entry-0"]> was present after 3 milliseconds.
  ✔ Testing if element <[data-testid="debug-log-entry-0"]> contains text 'Application startup complete' (8ms)
  ✔ Element <[data-testid="debug-log-entry-4"]> was present after 2 milliseconds.
  ✔ Testing if element <[data-testid="debug-log-entry-4"]> contains text 'FFT processing timeout' (8ms)
  ✔ Element <[data-testid="debug-log-entry-6"]> was present after 2 milliseconds.
  ✔ Testing if element <[data-testid="debug-log-entry-6"]> contains text 'Audio processing restored' (9ms)
  ✔ Element <[data-testid="debug-log-entry-8"]> was present after 3 milliseconds.
  ✔ Testing if element <[data-testid="debug-log-entry-8"]> contains text 'Speed calculation: 25.3 mph' (8ms)
  ✔ Element <[data-testid="debug-log-entry-9"]> was present after 2 milliseconds.
  ✔ Testing if element <[data-testid="debug-log-entry-9"]> contains text 'Doppler shift detected: +127 Hz' (9ms)
  ✔ Element <[data-testid="debug-log-entry-4"]> was present after 1 milliseconds.
  ✔ Testing if element <[data-testid="debug-log-entry-4"]> contains text 'ERROR' (8ms)
  ✔ Element <[data-testid="debug-log-entry-4"]> was present after 2 milliseconds.
  ✔ Testing if element <[data-testid="debug-log-entry-4"]> contains text 'FFT processing timeout' (10ms)
  ✔ Element <[data-testid="debug-log-entry-7"]> was present after 3 milliseconds.
  ✔ Testing if element <[data-testid="debug-log-entry-7"]> contains text 'WARN' (17ms)
  ✔ Element <[data-testid="debug-log-entry-7"]> was present after 3 milliseconds.
  ✔ Testing if element <[data-testid="debug-log-entry-7"]> contains text 'High CPU usage detected' (10ms)
  ✔ Element <[data-testid="debug-log-entry-6"]> was present after 3 milliseconds.
  ✔ Testing if element <[data-testid="debug-log-entry-6"]> contains text 'SUCCESS' (11ms)
  ✔ Element <[data-testid="debug-log-entry-6"]> was present after 4 milliseconds.
  ✔ Testing if element <[data-testid="debug-log-entry-6"]> contains text 'Audio processing restored' (11ms)
  ✔ Expected element <[data-testid="debug-log-container"]> to be visible (8ms)
  ✔ Expected element <[data-testid="debug-fft-status"]> to be visible (10ms)
  ✔ Expected element <[data-testid="debug-clear-button"]> to be visible (13ms)

  ✨ PASSED. 36 assertions. (441ms)

  Running debug console supports dynamic log updates after initial load:
───────────────────────────────────────────────────────────────────────────────────────────────────
  ✔ Element <[data-testid="test-name"]> was present after 17 milliseconds.
  ✔ Element <[data-testid="debug-toggle-button"]> was present after 3 milliseconds.
  ✔ Testing if element's <[data-testid="debug-toggle-button"]> inner text equals 'Hide Debug Console' (11ms)
  ✔ Expected element <[data-testid="debug-console-container"]> to be visible (11ms)
  ✔ Element <[data-testid="harness-log-count"]> was present after 5 milliseconds.
  ✔ Testing if element's <[data-testid="harness-log-count"]> inner text equals 'Log Count: 2' (10ms)
  ✔ Element <[data-testid="harness-expanded-state"]> was present after 2 milliseconds.
  ✔ Testing if element's <[data-testid="harness-expanded-state"]> inner text equals 'Debug Console State: EXPANDED (for testing)' (9ms)
  ✔ Element <[data-testid="debug-log-entry-0"]> was present after 7 milliseconds.
  ✔ Testing if element <[data-testid="debug-log-entry-0"]> contains text 'ADDED AFTER 1' (9ms)
  ✔ Element <[data-testid="debug-log-entry-0"]> was present after 3 milliseconds.
  ✔ Testing if element <[data-testid="debug-log-entry-0"]> contains text 'INFO' (8ms)
  ✔ Element <[data-testid="debug-log-entry-0"]> was present after 2 milliseconds.
  ✔ Testing if element <[data-testid="debug-log-entry-0"]> contains text '10:30:00' (9ms)
  ✔ Element <[data-testid="debug-log-entry-1"]> was present after 2 milliseconds.
  ✔ Testing if element <[data-testid="debug-log-entry-1"]> contains text 'ADDED AFTER 2' (8ms)
  ✔ Element <[data-testid="debug-log-entry-1"]> was present after 2 milliseconds.
  ✔ Testing if element <[data-testid="debug-log-entry-1"]> contains text 'INFO' (8ms)
  ✔ Element <[data-testid="debug-log-entry-1"]> was present after 2 milliseconds.
  ✔ Testing if element <[data-testid="debug-log-entry-1"]> contains text '10:30:05' (9ms)
  ✔ Expected element <[data-testid="debug-toggle-button"]> to be present (2ms)
  ✔ Expected element <[data-testid="event-log"]> to be present (3ms)
  ✔ Element <[data-testid="test-name"]> was present after 22 milliseconds.
  ✔ Element <[data-testid="harness-log-count"]> was present after 2 milliseconds.
  ✔ Testing if element's <[data-testid="harness-log-count"]> inner text equals 'Log Count: 5' (10ms)
  ✔ Element <[data-testid="harness-expanded-state"]> was present after 3 milliseconds.
  ✔ Testing if element's <[data-testid="harness-expanded-state"]> inner text equals 'Debug Console State: EXPANDED (for testing)' (9ms)
  ✔ Element <[data-testid="debug-log-entry-0"]> was present after 3 milliseconds.
  ✔ Testing if element <[data-testid="debug-log-entry-0"]> contains text 'ADDED AFTER 1' (10ms)
  ✔ Element <[data-testid="debug-log-entry-0"]> was present after 3 milliseconds.
  ✔ Testing if element <[data-testid="debug-log-entry-0"]> contains text 'INFO' (9ms)
  ✔ Element <[data-testid="debug-log-entry-0"]> was present after 3 milliseconds.
  ✔ Testing if element <[data-testid="debug-log-entry-0"]> contains text '10:30:00' (8ms)
  ✔ Element <[data-testid="debug-log-entry-1"]> was present after 3 milliseconds.
  ✔ Testing if element <[data-testid="debug-log-entry-1"]> contains text 'ADDED AFTER 2' (7ms)
  ✔ Element <[data-testid="debug-log-entry-1"]> was present after 3 milliseconds.
  ✔ Testing if element <[data-testid="debug-log-entry-1"]> contains text 'INFO' (9ms)
  ✔ Element <[data-testid="debug-log-entry-1"]> was present after 3 milliseconds.
  ✔ Testing if element <[data-testid="debug-log-entry-1"]> contains text '10:30:05' (8ms)
  ✔ Element <[data-testid="debug-log-entry-2"]> was present after 2 milliseconds.
  ✔ Testing if element <[data-testid="debug-log-entry-2"]> contains text 'Collaborator: High memory usage detected' (9ms)
  ✔ Element <[data-testid="debug-log-entry-2"]> was present after 3 milliseconds.
  ✔ Testing if element <[data-testid="debug-log-entry-2"]> contains text 'WARN' (7ms)
  ✔ Element <[data-testid="debug-log-entry-2"]> was present after 2 milliseconds.
  ✔ Testing if element <[data-testid="debug-log-entry-2"]> contains text '10:30:10' (9ms)
  ✔ Element <[data-testid="debug-log-entry-3"]> was present after 4 milliseconds.
  ✔ Testing if element <[data-testid="debug-log-entry-3"]> contains text 'System: Network timeout occurred' (9ms)
  ✔ Element <[data-testid="debug-log-entry-3"]> was present after 2 milliseconds.
  ✔ Testing if element <[data-testid="debug-log-entry-3"]> contains text 'ERROR' (8ms)
  ✔ Element <[data-testid="debug-log-entry-3"]> was present after 3 milliseconds.
  ✔ Testing if element <[data-testid="debug-log-entry-3"]> contains text '10:30:15' (9ms)
  ✔ Element <[data-testid="debug-log-entry-4"]> was present after 2 milliseconds.
  ✔ Testing if element <[data-testid="debug-log-entry-4"]> contains text 'User: Speed detection started' (9ms)
  ✔ Element <[data-testid="debug-log-entry-4"]> was present after 3 milliseconds.
  ✔ Testing if element <[data-testid="debug-log-entry-4"]> contains text 'INFO' (9ms)
  ✔ Element <[data-testid="debug-log-entry-4"]> was present after 3 milliseconds.
  ✔ Testing if element <[data-testid="debug-log-entry-4"]> contains text '10:30:20' (10ms)
  ✔ Expected element <[data-testid="event-log"]> to be present (2ms)
  ✔ Expected element <[data-testid="debug-toggle-button"]> to be present (2ms)
  ✔ Element <[data-testid="debug-toggle-button"]> was present after 2 milliseconds.
  ✔ Testing if element's <[data-testid="debug-toggle-button"]> inner text equals 'Hide Debug Console' (9ms)

  ✨ PASSED. 61 assertions. (590ms)


[Units Conversion Ct Nightwatch Test] Test Suite
───────────────────────────────────────────────────────────────────────────────
- Starting GeckoDriver on port 4444...

ℹ Connected to GeckoDriver on port 4444 (1780ms).
  Using: firefox (140.0) on LINUX.

- Loading url: http://localhost:3001/render-component/ControlsTestHarness?testName=Initial

  ℹ Loaded url http://localhost:3001/render-component/ControlsTestHarness?testName=Initial in 100ms
  ✔ Element <[data-testid="test-name"]> was present after 13 milliseconds.

  Running demonstrates mph → km/h → mph conversion cycle with full visibility:
───────────────────────────────────────────────────────────────────────────────────────────────────
  ✔ Element <[data-testid="test-name"]> was present after 26 milliseconds.
  ✔ Element <[data-testid="test-name"]> was present after 5 milliseconds.
  ✔ Testing if element's <[data-testid="test-name"]> inner text equals 'Test: Initial' (11ms)
  ✔ Element <[data-testid="unit-toggle-button"]> was present after 4 milliseconds.
  ✔ Testing if element's <[data-testid="unit-toggle-button"]> inner text equals 'Switch to
mph' (10ms)
  ✔ Element <[data-testid="harness-units-state"]> was present after 3 milliseconds.
  ✔ Testing if element's <[data-testid="harness-units-state"]> inner text equals 'Units: METRIC (km/h)' (8ms)
  ✔ Element <[data-testid="event-log"]> was present after 3 milliseconds.
  ✔ Testing if element's <[data-testid="event-log"]> inner text equals 'No events yet...' (7ms)
  ✔ Element <[data-testid="unit-toggle-button"]> was present after 3 milliseconds.
  ✔ Element <[data-testid="unit-toggle-button"]> was visible after 11 milliseconds.

  PASSED: 11 passed (544ms)

───────────────────────────────────────────────────────────────────────────────────────────────────

  ️TEST FAILURE (14.615s):
   - 0 assertions failed; 166 passed
   - 5 skipped

   ✖ 1) Controls.ct.nightwatch.test

   – demonstrates event coupling - recording toggle (481ms)

    SKIPPED (at runtime):
    - demonstrates event coupling - units toggle
    - shows processing state affecting component
    - complex scenario - multiple interactions with full trace
   ✖ 2) UnitsConversion.ct.nightwatch.test

   – demonstrates mph → km/h → mph conversion cycle with full visibility (544ms)

    SKIPPED (at runtime):
    - demonstrates units state with initial imperial mode
    - demonstrates units toggle with processing state

 Wrote HTML report file to: /home/paul/scm/car-doppler/test-results/nightwatch/nightwatch-html-report/index.html

Tearing down NightWatch test environment...
NightWatch vs Selenium-WebDriver JS
They’re the same “Selenium”, so both are using real browsers locally or remotely. NightWatch has a slightly different grammar tries to do more with less config files. It also has smooth built-in error reporting with automatic screenshots. I’m not showing the HTML report for that but it is pretty. You could make automatic failure screenshots for selenium-webdriver but it would require some coding setup. Nightwatch can also automate browser lifecycle for you. In my case I wanted one Firefox left open for all tests in a run, and that’s not (yet) configured in my project.
NightWatch.js strikes an excellent balance between power and simplicity, making it a solid choice for JavaScript teams wanting robust browser automation with a little less complexity of regular selenium-webdriver, yet still keeping the “real browser” selling point. It is also closer to the speed of Cypress.