Paul Hammant's Blog: Architecture Diagrams
Apologies to the time-honored 180 year old architecture profession, this is about software architecture a much younger interloper that reappropriated the ‘a’ word.
ThoughtWorker Lukasz Plotnicki had a great blog posting BFF @ SoundCloud. BFF is “Backend for Frontends”, by the way. The artwork on architectures alone great. It is quite close to the style I prefer. Let’s pick one of the ones from that article:
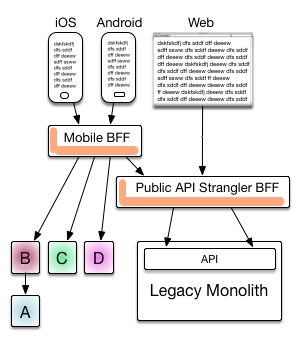
What I like:
- Top down nature - humans at the top transitioning through tiers to data-at rest at the bottom (implied in that diagram).
- It is process-centric. Some of their processes are services, some (web) servers.
- Directionality shows invocation not flow of data (though those diagrams are useful too).
Remember is process is a thing that appears in TaskManger (Windows) or “ps” (Unix). It may or may not be listening on a socket. It may or may not have timed or scheduled activities. It may or may not manage threads internally. It the smallest level at which Operating System carves up RAM and CPU attention.
What isn’t shown, the article was only about BFF:
- Scaling of each service/server or indeed which ones can’t be scaled (monolith implies that)
- and load balancing for that
- or reverse proxies
- Containment generally
- Protocols and payloads for connections
- Purpose of node, and technologies
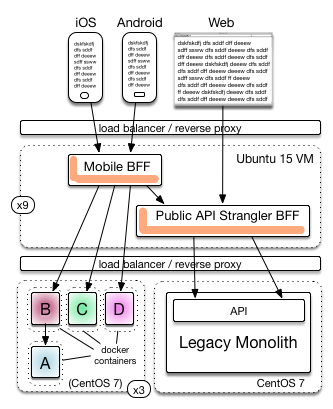
Containment
While Docker is the container of the year, containment can happen at a number of levels. I find all such things interesting for process architecture diagrams:
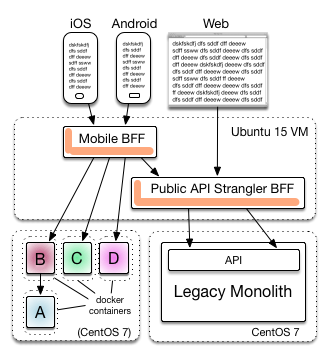
Containment goes further too - the Spring Framework is a container for components within one JVM. Unless you’ve implemented double-click to drill into a Tomcat processes, hosted web-apps and then into Springs hosted components show ing those graphically is too much for one chart.
Adding names of server technologies add to clarity too. Especially things like Tomcat which are containers too:
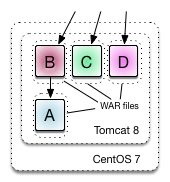
Increasingly though these days, teams instantiating Java web apps from the main method, and treating the HTTP functionality as a simple library.
Scaling
Horizontal scaling is the rule, in the modern era. Very few things are vertically scaled these days, so in my opinion we should try to give an indication of the former, at leave the latter to the imagination of the reader:
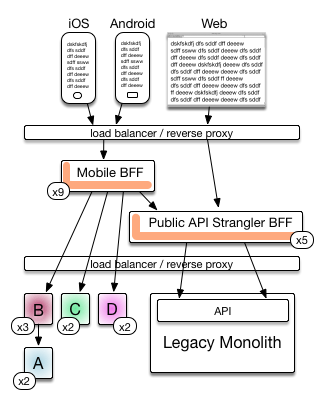
As you can see, we have choices too - should lines pass through a load balance (or reverse proxy) or connect to them? Whichever is least lines I think. Scaling can be on a machine that has more than one process (less popular these days):
The numbers of horizontally scaled nodes may change between production and non-production environments. If elastic scaling is what your organization is doing then representing a range (x100-200) is fine.
Protocols and payloads
Know what’s going up and down the stack is something else I think is important.
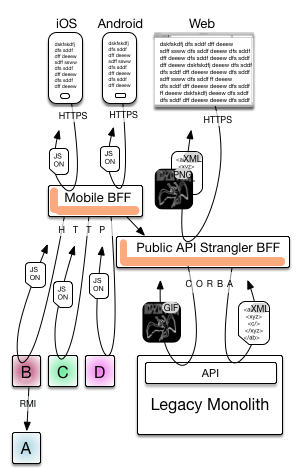
It’s more cluttered for the lines that are implying the bulk of the bytes of the conversation is in the reply and therefore maybe cacheable.
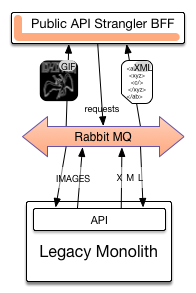
Busses
You know message queues, asynchronous pub/sub things…
Final thoughts.
I’ve not previously drawn in WebSocket style communications from a web server to a browser, and maybe architecture diagrams need that.
In other diagrams I have had to represent a file system directory or two. Some processes are doubtless watching them for “new” files. This is a rudimentary queue system, and common with FTP ingesting solutions. I use a manilla folder representation for that.
Labels for base languages like Java, Python can help where your organization develops with more than one. Then you would add a box for an in-house piece to help clarify it in the context of many more technologies. In most cases you will also want labels for the purpose of the thing/group: “Content Management”, “Media Streamer”, etc.
Of course, as mentioned before we might possibly have too many labels for one chart with everything I have listed above.