Paul Hammant's Blog: Angular Inside SVG Inside HTML
SVG embedded inside HTML, appears to simply extend the grammar of HTML, and perfectly co-exist in the DOM. Angular can latch on to that and work with it.
I tool a SVG map of the states of the USA from Wikipedia and embedded it in a HTML page. I added Angular and bound incarceration data from another wikipedia page and made that a JSON model for Angular to consume.
Here it is running in this page:
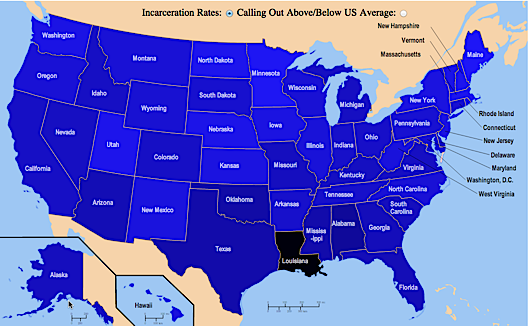
Yes you can interact with it. One view shows a blue with increasing darkness for incarceration rates. The other one has green to show below US average incarceration rates, and red to show above average rates. I’m not a statistician though, and the luminosity calculations could be off.
Pictures, for those that still can’t see anything:
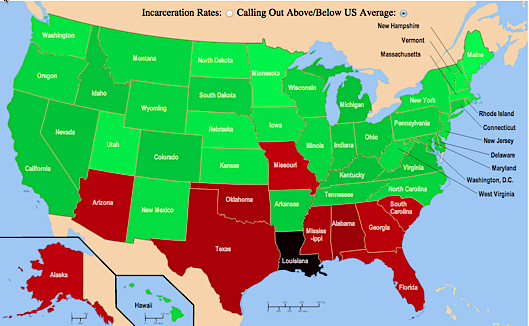
Compare to the Wikipedia picture - the hues/luminosity for which appear off. Louisiana vs Oklahoma is an example:

Here’s the code for the interactive map:
May 14, 2016
Updated for Angular 1.5.5