Paul Hammant's Blog: It is time for a new take on Spreadsheets
Exec Summary: A couple of hot web technologies, with another year’s worth of improvements and productization, could take over from classical fat clients Spreadsheet technologies like Excel.
Context
Microsoft has ruled the field of spreadsheets for 20 years now. Notwithstanding valiant efforts from earlier forerunners like Visicalc, Lotus123, latter initiatives like OpenOffice’s Calc, GoogleDocs, and Apple’s Numbers, Microsoft still owns the field. There’s been some insightful analysis that this could change, especially because of tablet computing (I forget the link), but we’re not even being warmed up to alternatives to the same installable, fat ‘Excel’ design for online AND offline use.
Grids, values, formula and style
What we have with the standard Excel design is ‘View’ and ‘Model’ intermingled in a rigid grid. One types numbers (or strings) in to cells, as well as formulae and finally use menu-options/ribbon/toolbar to effect style changes. The grid is the dominant feature of a current spreadsheet. It is grid where the aesthetics of a spreadsheet and the backing data meet. This is the first legacy issue in my opinion. Developers have been decoupling model and view for user interfaces since 1978 and I don’t know why we’ve suffered the grid for so long.
From here on, I’m going to assume that we all understand the A-Z 1-99 style cell naming from here on. If not read this. If you’ve not even got time for that, quickly consume this: Copy and pasting a cell (by default) takes its style, formula (or value) to the destination call. If that is a formula, then the paste adjusts the column and row reference relatively for the most part. A formula of for cell A3 could be ‘=A1/A2’. If pasted to B3 it would be ‘=B1/B2’. If one of the cells in anchored, then it affects the nature of the pasted formula - ‘A3 = $A1/A2’ pasted in a ‘B’ column would be ‘B3 = $A1/B2’. For output style, cells/rows/columns are programmed by invoking menu options, or clicking of desired changes in a toolbar or the ribbon.
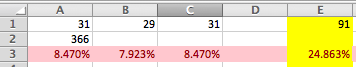
Here is a simple spreadsheet with three columns representing Jan, Feb, Mar and one for total. The first row with the days in 2012 for each month, a second row with a single cell for the number of days in the whole year, and a third row with percentages of the year total. I’ve made the whole of row 3 red, with ‘percentage’ the format of the cells, and an extra decimal position beyond the two normal for ‘percentage’ as Excel has it. I’ve also made the total column on the right, yellow.
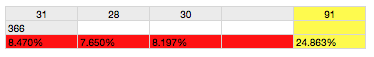
The same for Apple’s Numbers:
Open Office’s Calc and GoogleDocs are more or less the same in aesthetics and operation.
One more complaint on the ‘Excel way’ of doing things: If I click on a cell, I can see some of the style choices for it, but not all in a concise list. For the percentage cells I can only see that it’s percentage, but not that the other non-default aspects are yellow background, and one extra decimal position:
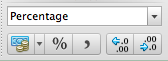
Thats seems silly in 2012, that the formatting settings (or at least differences to default) for a cell are not summarized in a info-panel.
What’s stored
Here is what Excel stores the sheet (reformatted for readability):
<?xml version="1.0" encoding="UTF-8" standalone="yes"?>
<worksheet xmlns="http://schemas.openxmlformats.org/spreadsheetml/2006/main"
           xmlns:r="http://schemas.openxmlformats.org/officeDocument/2006/relationships"
           xmlns:mc="http://schemas.openxmlformats.org/markup-compatibility/2006" mc:Ignorable="x14ac"
           xmlns:x14ac="http://schemas.microsoft.com/office/spreadsheetml/2009/9/ac">
  <dimension ref="A1:E3"/>
  <sheetViews>
    <sheetView tabSelected="1" workbookViewId="0">
      <selection activeCell="E5" sqref="E5"/>
    </sheetView>
  </sheetViews>
  <sheetFormatPr baseColWidth="10" defaultRowHeight="15" x14ac:dyDescent="0"/>
  <sheetData>
    <row r="1" spans="1:5">
      <c r="A1">
        <v>31</v>
      </c>
      <c r="B1">
        <v>29</v>
      </c>
      <c r="C1">
        <v>31</v>
      </c>
      <c r="E1" s="1">
        <f>SUM(A1:C1)</f>
        <v>91</v>
      </c>
    </row>
    <row r="2" spans="1:5">
      <c r="A2">
        <v>366</v>
      </c>
      <c r="C2" s="2"/>
      <c r="E2" s="1" t="s">
        <v>0</v>
      </c>
    </row>
    <row r="3" spans="1:5">
      <c r="A3" s="3">
        <f>A1/$A2</f>
        <v>8.4699453551912565E-2</v>
      </c>
      <c r="B3" s="3">
        <f>B1/$A2</f>
        <v>7.9234972677595633E-2</v>
      </c>
      <c r="C3" s="3">
        <f>C1/$A2</f>
        <v>8.4699453551912565E-2</v>
      </c>
      <c r="D3" s="3"/>
      <c r="E3" s="4">
        <f>E1/$A2</f>
        <v>0.24863387978142076</v>
      </c>
    </row>
  </sheetData>
  <pageMargins left="0.75" right="0.75" top="1" bottom="1" header="0.5" footer="0.5"/>
  <extLst>
    <ext uri="{64002731-A6B0-56B0-2670-7721B7C09600}"
         xmlns:mx="http://schemas.microsoft.com/office/mac/excel/2008/main">
      <mx:PLV Mode="0" OnePage="0" WScale="0"/>
    </ext>
  </extLst>
</worksheet>
Actually that’s one file of twelve or so inside a zip file ending in .xlsx
Open Office does the same XML inside zip file. The source form is not really end-user editable. Older Excel file formats were binary and totally un-editable. Apple’s Numbers app saves a zip too, with less files inside it than Excel. One is the XML containing our meager 45 cells. The trouble is that the XML is completely unreadable (1,095,369 bytes).
Terser, more readable source forms
As mentioned before, developers would normally separate model from view. Lets be inspired and illustrate a file format with a such a separation:
The ‘Model’ in JSON format:
this.daysInYear = 366;
this.months = [
  { days: 31 },
  { days: 28 },
  { days: 30 }
];
The ‘View’ in HTML:
<table>
 <tr>
  <td ng-repeat="month in months"></td>
 </tr>
 <tr>
  <td></td>
 </tr>
 <tr ng-style="redBackground">
  <td ng-repeat="month in months">{{month.day / daysInYear *100 | number:3 | percentage}}</td>
 </tr>
</table>
Now, frequent readers will have note that I have used AngularJS here. Obviously it is an extended HTML, showing attributes that have meaning for our particular view. It, and the very similar Knockout are quickly becoming my ‘go to’ web technologies.
Note that the ‘model’ does not contain the formula. It’s wrong to have that in the ‘view’, as it should be in the model instead:
  daysInYear: 365;
  months: [
    { days: 31, pct: '=days/daysInYear' },
    { days: 28, pct: '=days/daysInYear' },
    { days: 30, pct: '=days/daysInYear' }
  ]
There must me a terser [lambda-eqse](http://en.wikipedia.org/wiki/Lambda_(programming) way of doing that!
The view being HTML is less than perfect. That is what Angular uses of course, so its constrained. It would be nice to see a Markdown style of programming AngularJS enabled markup.
Backing with Source Control
Also a fairly standard wish for ‘documents’ that are iteratively and collaboratively worked on: Source Control as the canonical store for the data. With that and carriage-return delimited text forms, I get easy versioning, a decent audit right down to ‘who’ made a change. Diffs on textual forms, are the pinnacle of tracking change in my opinion. Also it is the pinnacle of roughly measuring employee contribution, and it would be nice to pull managers into that too.
Not all SCMs are equal though, but I’ll not go into that now. Here is Git and GitHub used as the SCM, with AngularJS as the facilitator of this spreadsheet vision (as above).
Screenshot: 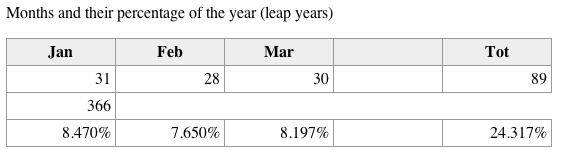
Incidentally, there were two commits that made the app. You’ll note that there’s a “Jan, Feb, Mar” line not previously mentioned. It was added in the second commit. GitHub makes that pretty for us. The diff would be smaller if I didn’t have to change ‘th’ element to ‘td’ in HTML. It’s small enough, and should reinforce one of the major points I’m trying to promote here - terse textual forms in a source control package facilitate good audit trials for tracking changes over time.
The ‘before’ visuals, you could have guessed, looked like: 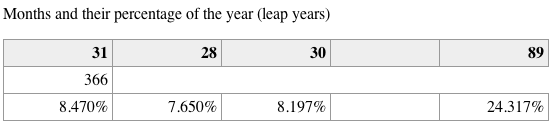
Incidentally, I copied the style from a more functional Knockout spreadsheet that I found by googling, and have copied from JSFiddle for posterity. It was made by ‘pokle’. The Knockout one accepts edits, but if you look at the source it is back in the realm of ‘huge’ again. One of the points to this proposal is that the spreadsheets themselves could not be any smaller. In my Angular version there is no editing capability build in (more later).
Also, to aid terseness, I’m leaning on an older version of Angular that has aggregate functions built in. Versions since 1.0 do not. One of a spreadsheet’s killer features is ‘Sum’. Version 0.9.19 of Angular (and earlier) had built-in functions that allowed arrays to have aggregate functions. Min, Max Count, Average are aggregate functions that would be worthy of ‘built in’ status. In the source look at lines 42 and 50.
Live data
We’re hypothesizing that this sheet’s natural form is HTML + JSON, and thus by implication it’s served over HTTP. Maybe that’s not a public site, and instead is subject to a login like GoogleDocs, but there is every possibility that sections of the document could be live rather that static. Think MSFT current stock price. That could be served up by the same service that hosts the spreadsheet, or it could be pulled from elsewhere in a mashup style.
In-Browser editing of content, via plugins
Batarang delivered on the idea of general purpose browser plugin for the likes of Angular. There will be more browser plugins to follow. It’s general purpose and aimed at Developers, and makes the field even more alluring for cost-conscious web developers.
The Angular spreadsheet as mentioned does not have an edit capability. What I hope for is an custom browser plugin for Angular spreadsheet editing. When you’re viewing an angular spreadsheet, you can hit a hot-key and go into edit mode (the plugin). Make some changes, then save that back again to the server (subject to authority) or the file system. Here’s what that could look like:
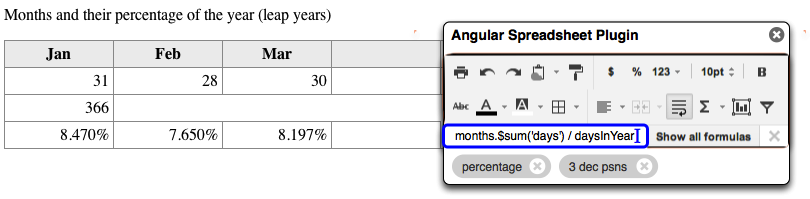
This ‘redefined spreadsheet’ concept I’m advocating would need this piece to take root.
The normal form of the spreadsheet was readonly (with real calculations), but with the browser plugin, it’s a very usable solution. I myself would prefer a true SCM backing store, but others may prefer a database. If editing a spreadsheet served from the file-system (rather than HTTP), the plugin could simply overwrite the source files. I half remember some news around Chrome’s DOM inspector being upgraded to allow saving to the file system (can someone link me to the blog entry).
General purpose Web Technologies coming of age.
Angular already had the ability to mimic a rudimentary spreadsheet about three years ago. What I represent above is a good deal of typing to do something that was easy in Excel. At least without the plugin. That said, I can’t help but feel that there’s a real future for this shift in realization of spreadsheet.
More on Excel
We should not forget that the HTML and CSV export from Excel lose formulae, and instead show values only. CSV loses formats too of course. It’s not a tool for embedding. Microsoft had OLE for many years, and there’s no such equivalent on the Mac. It was quite powerful. I’ve not been able to find it in recent Windows version of Excel :-(
Excel has the ability to honor choices about page breaks, margins and sizes (etc). This is powerful in that Carina can edit spreadsheets and email them to a distribution list. All the recipients will be able to print them with impunity (ignoring A4 vs ‘US Letter’ issues).
Smallest Federated Wiki
Ward Cunninghams’s Smallest Federated Wiki. Many years ago I heard Ward described as ‘The grand-pappy of modern programming’ and I’m inclined to agree having met him a few times. Ward’s new wiki technology (He’s Mr Wiki remember) embeds formulae and tabular data, and allows decidedly free-form documents containing spreadsheet style functions. The idea of client-side live documents is already taking foot. There was something a year or so ago from MIT if I remember correctly.
Lastly: Adoption
Nobody from the business world is going to use it from a pitch route. Excel is where it remains by default. That said programmers are used to moving the bar ahead of where non-programmers are comfortable. If this stuff were shipped, and solid, business people would flip to use it after trying it out for a while. They’d also get with the duality of WYSIWYG editing and the backing source form, source control generally, and diffs specifically. Can someone with some VC capital make this please ?
Incidentally, Excel will export to HTML (Numbers won’t). Its verbose HTML though, and contains values only.
Oct 8th 2012 follow up: JSONIQ
Aggregate Functions in JavaScript - JSONIQ - lovely.
Apr 7 2014 follow up: Bad spreadsheet, bad!
Paul Krugman, on the NyTimes - The Excel Depression