Paul Hammant's Blog: Performance Testing Knockout, Angular and Backbone with Selenium2
Following on from Monday’s Selenium2 demo of ‘functional testing demo’ for Angular and Knockout, I thought I’d expand what I had into a performance test seeing as there are no server GETs or POSTs after loading each TodoMVC app. Monday’s test scripts have been morphed into ones that are less a demonstration of fluent-selenium, and more a harness for the repeated addition of Todos into the Todo-list. Specifically, rather than loop through items, I’m going straight to the last matching one for an XPath selector via ‘//whatever[xxxxx and position() = last()]’. I have a github project for the test scripts and the results (CSV). Selenium2 has a ‘feature’ whereby it needs to have the widget that it’s intersecting with visible on the page, and consequentially does a lot of scrolling for these apps. I want to add 1000 Todos for this performance test, and fear the cost of the constant scrolling within the browser. I measured it, and the cost is real - like up to 10% of the over all time taken for the test, so I’ve forked Addy Osmani’s TodoMVC demo apps to make the input field for “new Todos” at the bottom of the list rather than the top. I’ve also deliberately detached the CSS, so that thus is a raw performance test of the Client-Side MVC framework. I could not measure much of a difference for that last though. The test comprises i) Adding a Todo, ii) Locating it in the list and verifying that it was added, and iii) clicking the “done” checkbox. That means that the substantial testing of the Client-Side MVC framework was an a) add to the model, b) a change to an item in the model, c) view updates to reflect that, and d) a consequential change to a ‘remaining todos’ counter. I’ve also tested that Selenium2 itself is not responsible for the slow-down by timing some of its DOM traversals that are not associated with a change to the model.
Results.

Can you see that? Backbone and Knockout are kinda constant at 132ms and 123ms respectively per iteration. Angular starts slight better than those two, but moves up to 400ms per iteration by #1000. Click here to see a large PDF of the whole chart (sideways scrolling required).
I’ve done multiple runs on this 8Gb SSD Mac to ensure consistency. The AngularJS chart, for one, was odd enough to warrant further inspection. Here are two runs overlaid on the same chart (and zoomed in):
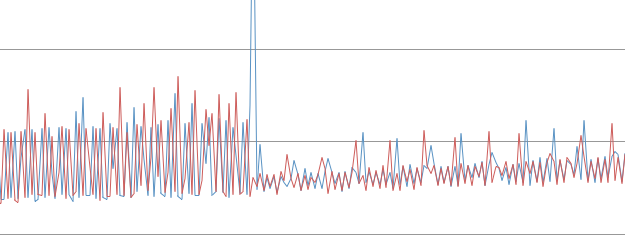
Weird huh? Almost identical. I can only think that’s an interaction between AngularJS, the JavaScript environment of Firefox 10.0.2, and the vanilla JavaScript model. It could be that Selenium2 is erroneously waiting for interactions to finish slightly longer than necessary, meaning the slow-down is not real. Specifically, AngularJS polling for changes in either direction, might be enough to thwart Selenium’s “document ready” detection.
Conclusion
I still think that the productivity benefits of AngularJS makes it very much ‘worth it’ compared to Backbone. AngularJS at the 2001 model-bound nodes in the view (1000 output fields from a model + 1000 input/output rows from that model + 1 calculated field) is still working faster than humans can type. KnockoutJS takes slightly more coding that the equivalent AngularJS app, but has the best performance at that 2001 node limit. Backbone takes much more coding, making your productivity benefits dissapear. I’d still use Knockout and AngularJS instead of Backbone every time.
JQuery Foot-note.
I was going to similarly measure the performance of Addy’s JQuery+Moustache example, but Selenium could not locate the input-field when I moved it down the page. If I left it at the top, and ran the test anyway, it was taking 600ms per iteration at the end. Here’s a video that has NOT been slowed down:
PS - thanks to colleague Tarek Abdelmaguid for the Backbone version of the groovy script.
Syndicated
Jun 20, 2012: This article was syndicated by DZone